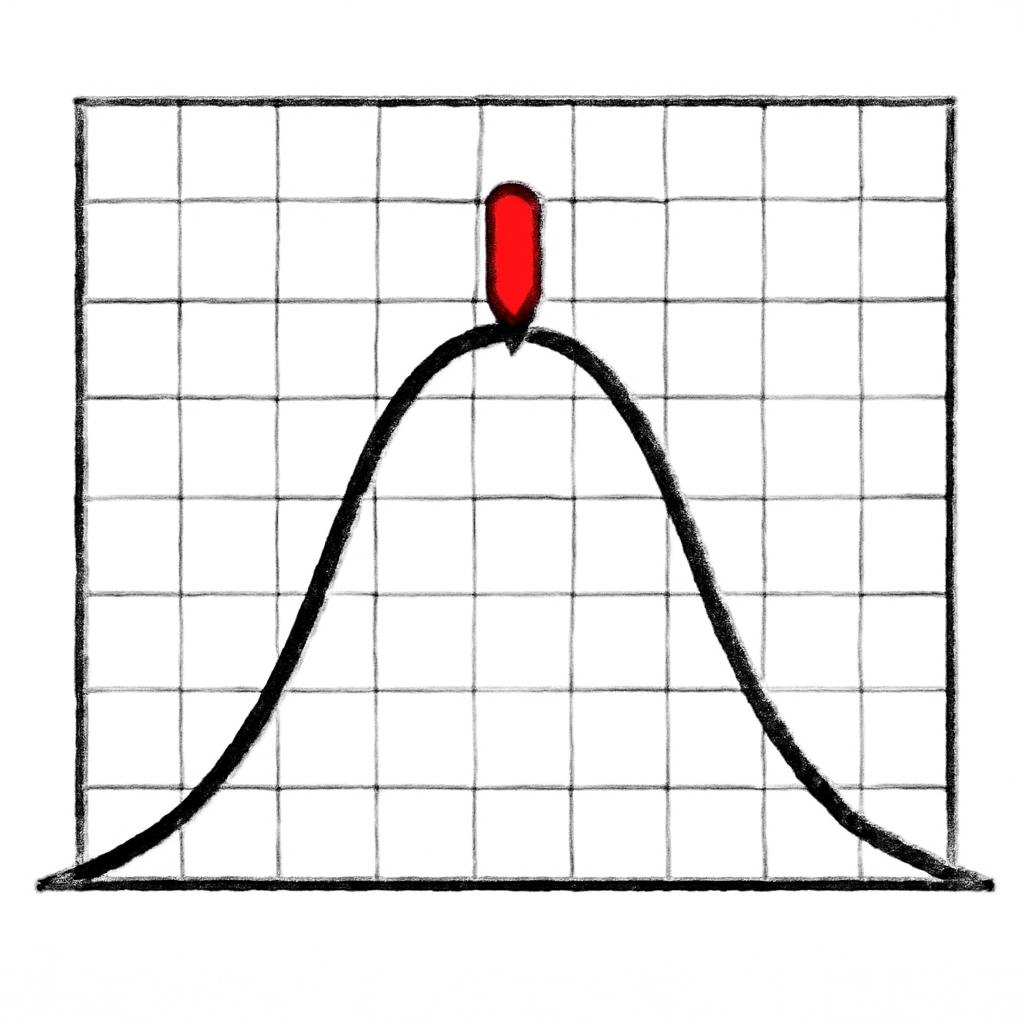
The normal distribution
The familiar bell curve. Often the right model. Often the wrong one.
The normal distribution shows up when many small independent effects add up. Height, measurement error, exam scores. Where it applies, you get nice properties: a meaningful average, a defined standard deviation, predictable tails.
The trap is assuming it applies when it doesn't. Many of the most important quantities in social life (wealth, market returns, war casualties, book sales) follow power laws or fat-tailed distributions, not normal ones. Using normal-distribution intuitions on those quantities produces consistent underestimation of extreme events.
For operators, a useful question: is this quantity built from many small independent additions (then normal probably applies) or from cumulative multiplicative effects, network effects, or winner-takes-most dynamics (then it doesn't)? Wrong model, wrong intuitions.
Examples in the wild
Salary distributions inside companies are roughly log-normal. Talking about "the average employee" or "the standard deviation of compensation" using normal-distribution math gives wrong intuitions.
Most options pricing models assume returns are normal. They aren't (fat tails). The 2008 crisis was partly caused by models that gave nonsensical answers in the tail.
Most height differences in your everyday life are within a couple of standard deviations of the mean. Most wealth differences are not. Different distributions, different intuitions.
The normal distribution is one of the mental models we apply through real cases inside the Pareto MBA — a part-time program for professionals who want to think clearly about business.